You're exhausted, foggy, cold, flat, not recovering the way you used to. You finally get blood work done, and the results come back "all normal." So you're left with the same symptoms and no explanation, just the sense that you're either imagining it or it's all in your head.
You're probably not imagining it. "In range" answers one narrow question: are your numbers inside the band where most of a reference population falls. It doesn't automatically explain your symptoms, and it doesn't prove your body is working well. Being inside the range and being genuinely well are two different tests, and the standard one only checks the first.
I've been the person holding a folder of normal results while feeling terrible. It's part of why I do this work the way I do.
Key takeaways
- A "normal" result means your number sits within the central 95% of a reference population. It doesn't prove your body is working well.
- Symptoms can persist inside the range from early dysfunction, a result sitting at the far end, a shift from your own baseline, or the wrong markers being ordered.
- A single marker often misleads. Ferritin needs the rest of the iron panel, TSH needs free T4, free T3 and antibodies, and B12 sometimes needs active B12 or methylmalonic acid.
- Insulin resistance can build for years before fasting glucose or HbA1c moves.
- Reference ranges vary between labs, and no single "optimal" number is right for everyone.
What a reference range actually means
A reference range, or reference interval, is worked out by measuring a marker in a large group of apparently healthy, disease-free people and taking the central 95% of their results (Timbrell, 2024). The middle 95% becomes "normal," and the top and bottom 2.5% get flagged.
That's a sensible way to build a screening tool. It's not the same as a measure of optimal function, and being inside the interval doesn't necessarily mean the absence of disease or dysfunction (Timbrell, 2024). It tells you that you look like most of the reference group. It doesn't tell you the marker is where it needs to be for you to feel and perform well.
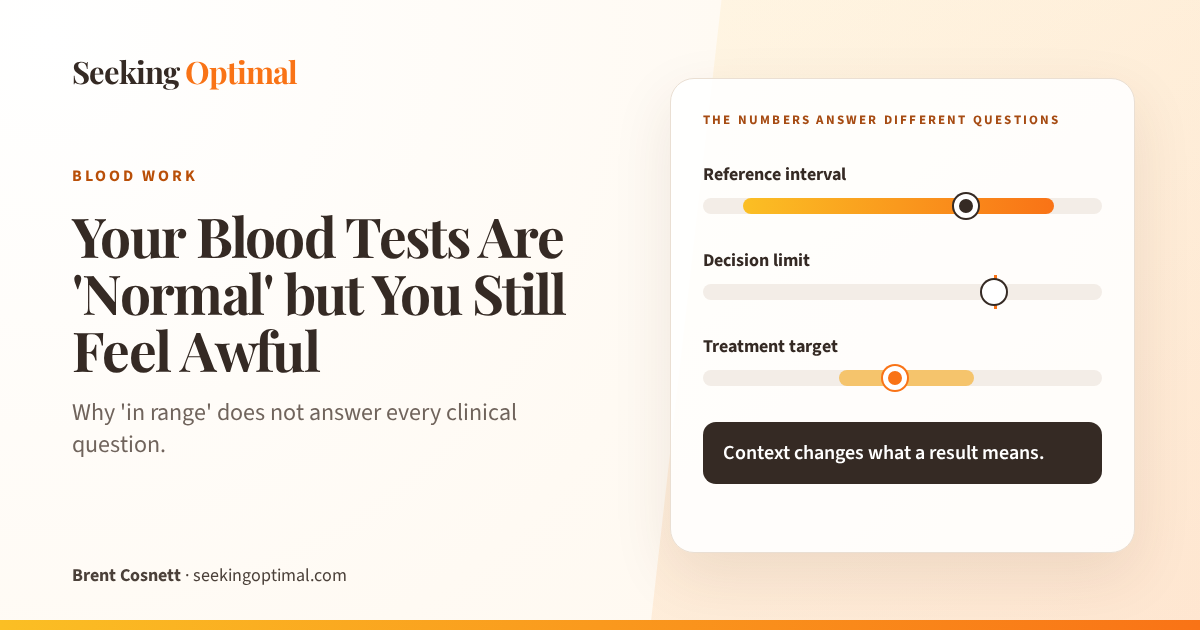
It also helps to know that a reference range isn't the only kind of cutoff on a blood report. Some markers are judged against clinical decision limits or treatment targets set by guidelines, which are chosen to flag future risk rather than to describe the middle of a healthy population (Horowitz, 2008). Cholesterol is the common example. So "reference range," "diagnostic cutoff," and "treatment target" are three different things, and they don't all mean "this is where you should sit to be well."
Why symptoms can exist inside the range
Symptoms can persist inside the reference range for several reasons, and none of them require your bloods to look abnormal.
You might have early or subclinical dysfunction that hasn't crossed the diagnostic line yet. You might be sitting right at one end of a broad interval, technically "in range" but a long way from where most well people cluster. A single marker might have been read on its own when it only makes sense next to its related markers. Your result might be normal for the population but a clear shift from your own baseline, which nobody can see without your previous results. The wrong markers might have been ordered, so the one that would explain things was never measured. Or the result might be temporarily skewed by a recent illness, hard training, fasting status, where you are in your cycle, a medication, or a supplement.
There's also a plain limit to what routine blood work can do. Some conditions aren't diagnosed from a standard panel at all, so a clean set of bloods doesn't rule them out.
A few examples worth understanding
Rather than list every marker, here are a few that show the pattern clearly.
Ferritin and iron
Ferritin reflects your iron stores, and it's the single most useful blood test for picking up iron deficiency (Guyatt et al., 1992). The reference range is wide, often something like 30 to 300 depending on the lab and your sex, so a result of 35 gets a tick.
The problem is that a ferritin below about 30 already indicates iron deficiency, and iron deficiency causes fatigue and other symptoms well before it ever shows up as anaemia on a standard full blood count (Al-Naseem et al., 2021). Iron deficiency runs in stages: your stores drop first, and haemoglobin only falls at the end (Camaschella, 2015). So "you're not anaemic" can be true while you're genuinely low on iron and feeling it. One catch worth knowing: ferritin also rises with inflammation, so in that setting the threshold is lifted to around 100, and a single ferritin is best read alongside the rest of the iron panel, which often doesn't get run (Al-Naseem et al., 2021).
TSH and the thyroid
TSH usually has a reference range of roughly 0.4 to 4.0. Someone can sit at the higher end with fatigue, cold hands, and weight that won't shift, and be told their thyroid is fine.
Subclinical hypothyroidism is a recognised state in the medical literature: free T4 and free T3 sit within their ranges while TSH is raised, and it can carry real effects (Biondi and Cooper, 2008). A lone TSH also can't tell the whole story. It reads differently next to free T4, free T3, and thyroid antibodies, plus your symptoms and any medication. Where the "ideal" TSH sits is genuinely debated, so this isn't about swapping the lab's number for a single magic one. It's about reading the thyroid as a panel rather than a single value.
Vitamin B12
B12 is a good example of why one number isn't enough. No single B12 test is reliable in isolation. Total serum B12 can look adequate while you're functionally low, which is why active B12 (holotranscobalamin), methylmalonic acid, and homocysteine are used to sort out the indeterminate cases (Bedz and Forsyth, 2026). A "normal" serum B12 on its own doesn't always close the question.
Glucose and HbA1c
A normal fasting glucose or HbA1c is reassuring, but it can sit on top of a metabolism that's already drifting. In the Whitehall II study, insulin sensitivity fell steeply across the 5 years before a diabetes diagnosis, while fasting glucose only climbed sharply in the last 3 (Tabák et al., 2009). By the time glucose or HbA1c crosses a line, the problem has usually been building for years. Reading them alongside fasting insulin gives a much earlier picture than glucose alone.
A note on all of these: reference ranges vary between labs, and there's no single "optimal" number that's right for every person. Be wary of anyone, including a chart on the internet, who tells you one universal value is where you must sit.
Why the panel you get ordered matters
A lot of "your bloods are normal" comes down to how few markers were actually run. A minimal screening panel can miss the very thing that explains how you feel, simply because it wasn't tested.
A fuller work-up looks at markers in the groups that actually answer questions. A complete iron panel rather than ferritin alone. A full thyroid panel with free T4, free T3, and antibodies, not a lone TSH. B12 with folate, and the functional markers where the picture is unclear. Metabolic markers including fasting insulin, not just glucose. Inflammation markers like hs-CRP and ESR. The red cell indices on a full blood count. None of this means everyone needs every test going. It means the panel should be matched to your symptoms and history, not shrunk to the smallest default.
What to do when your results are 'normal' but symptoms persist
If you've been told you're fine while knowing you're not, a few things help.
Ask what was actually tested, and get copies of your results rather than just the "all normal" summary. Look at your numbers as a pattern and over time, because a marker drifting across your own previous results can matter more than where it sits in the population range. Keep discussing persistent symptoms with an appropriate clinician, and push for investigation beyond routine blood work when the symptoms justify it. And be careful about self-diagnosing off internet range charts, which tend to turn one number into a verdict.
That's roughly how good blood-work interpretation runs in practice. Start with the symptoms, history, training, sleep, medications, and what you're actually trying to fix. Read related markers together as patterns rather than one at a time. Compare against previous results to see the direction of travel. Form a working idea of what's going on, change the inputs that matter, then retest and adjust. It's less about a single perfect number and more about the whole picture moving in the right direction.
FAQ
Can blood tests be normal when something is wrong? Yes. A normal result means you're inside the range where most of a reference population falls, not that your body is working well or that nothing's wrong. Early dysfunction, a result sitting at the far end of a wide range, a shift from your own baseline, or simply the wrong test being ordered can all leave you symptomatic with "normal" bloods.
What's the difference between a reference range and an optimal range? A reference range is the central 95% of a healthy reference population, built as a screening tool. An "optimal range" is a narrower band some practitioners use to describe where people tend to feel and function best. Reference ranges are standardised and evidence-based. Optimal ranges vary and aren't all settled science, so they're best treated as a guide to investigate further, not a self-diagnosis.
Which blood tests are often missing from a routine panel? It varies, but common gaps include a full iron panel rather than ferritin alone, free T3 and thyroid antibodies rather than TSH alone, fasting insulin alongside glucose, functional B12 markers, and inflammation markers. The right additions depend on your symptoms, not a fixed list.
Can supplements distort blood-test results? They can. Biotin can interfere with some assays, recent iron or B12 supplementation can lift those readings, and timing relative to a dose matters. It's worth telling whoever orders your bloods what you're taking, since it changes how a result should be read.
How often should blood work be repeated? It depends on what you're tracking and what you've changed. When you're working on something specific, retesting after a meaningful interval, often a few months, shows whether the change is landing. The trend across results usually tells you more than any single snapshot.
The practical bottom line
If you've collected a stack of "normal" results and still feel off, the answer usually isn't another basic panel. It's a fuller set of markers read against your symptoms, your history, and your goals, then a targeted plan based on what actually shows up.
That's what a personalised blood-work analysis is for. It combines the bloods with the rest of the picture, looks at the markers that fit your situation, and turns the findings into something you can act on. If you're tired of being told you're fine while knowing you're not, that's a more useful place to start than repeating the same short panel.
References
Timbrell NE. The role and limitations of the reference interval within clinical chemistry and its reliability for disease detection. British Journal of Biomedical Science. 2024;81:12339. https://pubmed.ncbi.nlm.nih.gov/38481978/
Horowitz GL. Reference intervals: practical aspects. EJIFCC. 2008;19(2):95-105. https://pubmed.ncbi.nlm.nih.gov/27683304/
Biondi B, Cooper DS. The clinical significance of subclinical thyroid dysfunction. Endocrine Reviews. 2008;29(1):76-131. https://pubmed.ncbi.nlm.nih.gov/17991805/
Al-Naseem A, Sallam A, Choudhury S, Thachil J. Iron deficiency without anaemia: a diagnosis that matters. Clinical Medicine (London). 2021;21(2):107-113. https://pubmed.ncbi.nlm.nih.gov/33762368/
Guyatt GH, Oxman AD, Ali M, Willan A, McIlroy W, Patterson C. Laboratory diagnosis of iron-deficiency anemia: an overview. Journal of General Internal Medicine. 1992;7(2):145-153. https://pubmed.ncbi.nlm.nih.gov/1487761/
Camaschella C. Iron-deficiency anemia. New England Journal of Medicine. 2015;372(19):1832-1843. https://pubmed.ncbi.nlm.nih.gov/25946282/
Bedz D, Forsyth C. Vitamin B12 deficiency: testing and treatment. Australian Prescriber. 2026;49(2):55-60. https://pubmed.ncbi.nlm.nih.gov/42022258/
Tabák AG, Jokela M, Akbaraly TN, Brunner EJ, Kivimäki M, Witte DR. Trajectories of glycaemia, insulin sensitivity, and insulin secretion before diagnosis of type 2 diabetes: an analysis from the Whitehall II study. Lancet. 2009;373(9682):2215-2221. https://pubmed.ncbi.nlm.nih.gov/19515410/